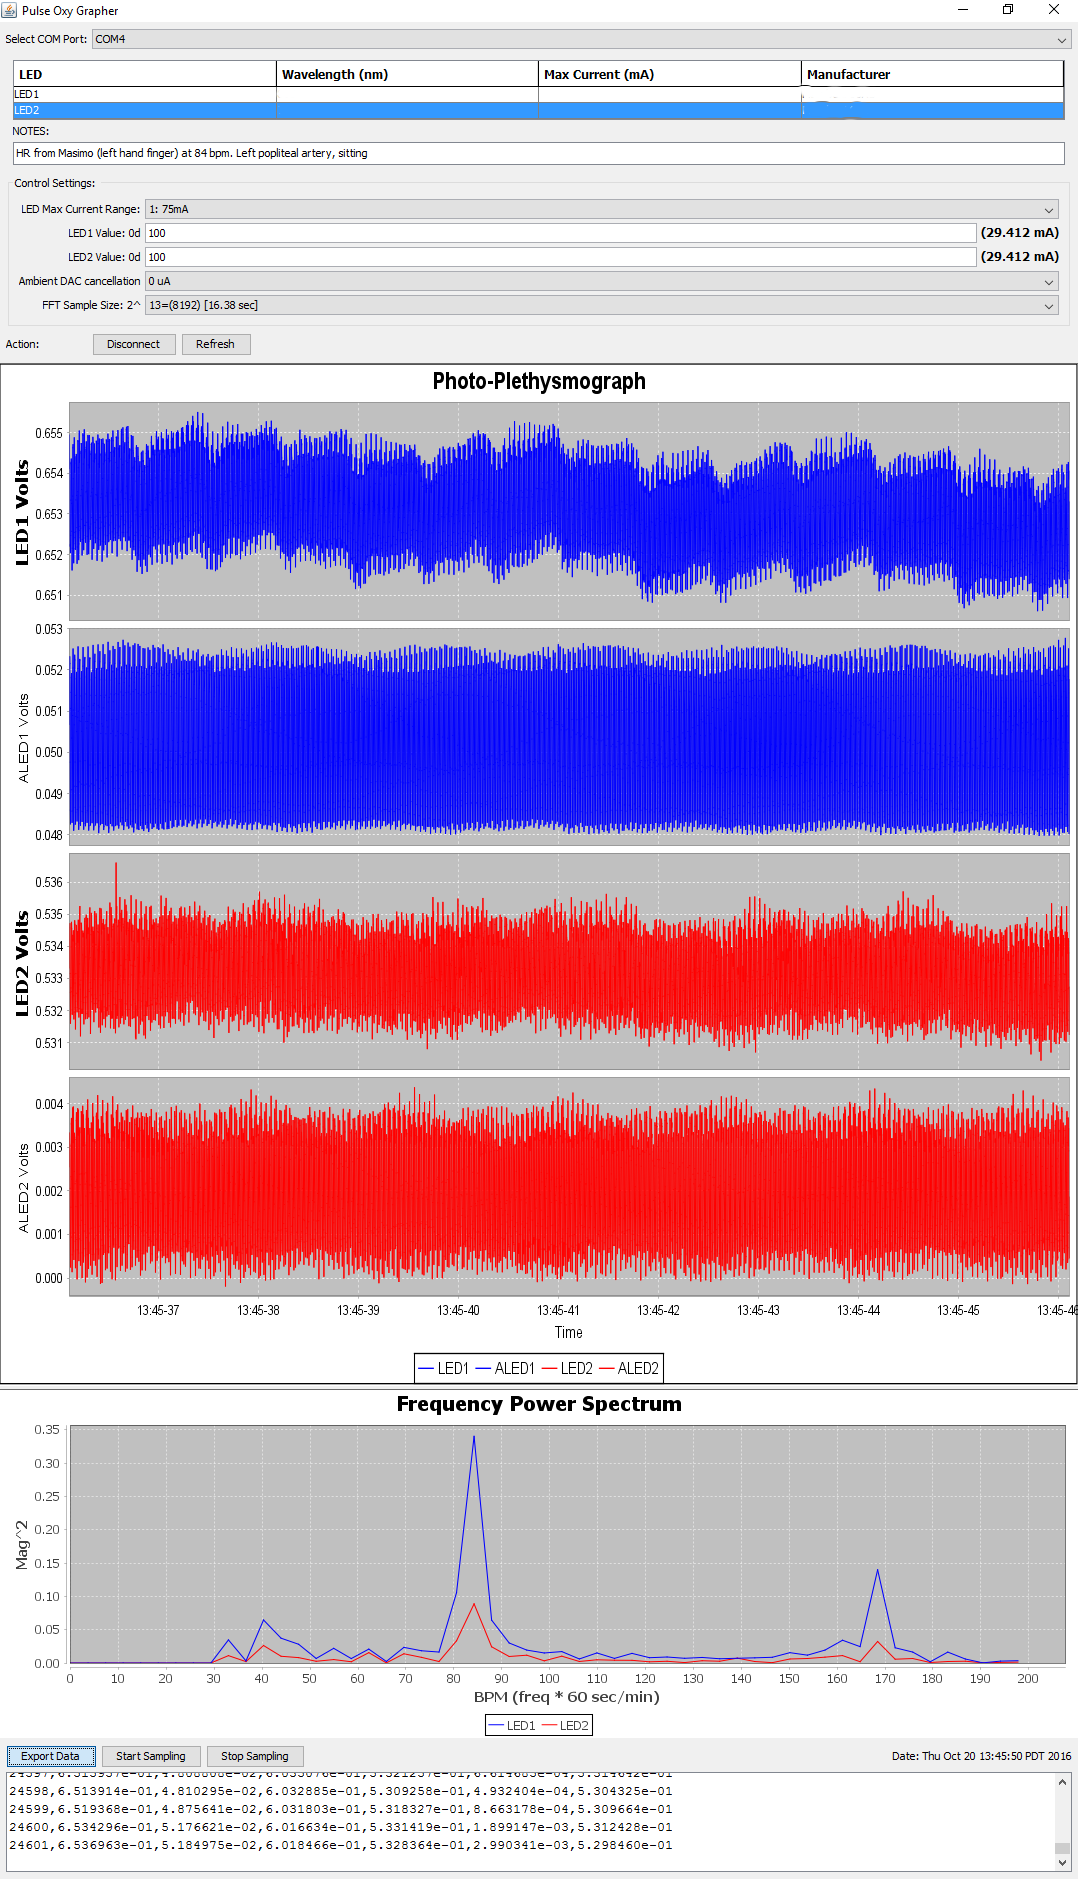
A screenshot of the custom software with a measurement taken from the popliteal artery of a volunteer. The top blue and red graphs correspond to two different wavelengths of light being shone and the two graphs below them are the ambient measurements taken after the reading. The graph below displays the frequency spectra of PPG, showing a significant peak at the heart-rate at 84 bpm, and the second-harmonic at around 168 bpm.