Introduction
Lung cancer is the number one cause of cancer deaths. Many early stage lung cancer patients have a resectable tumor, however, their cardiopulmonary function needs to be properly evaluated before they are deemed operative candidates. Pulmonary function is assessed via spirometry and diffusion capacity. If these are below a certain threshold, cardiopulmonary exercise testing (CPET) is recommended. CPET is expensive, labor intensive and sometimes ineffective since the patient is unable to fully participate due to co-morbidities, such as limited mobility. In addition, CPET is done using a set of physical activities that may or may not be relevant to the patient’s typical activities.
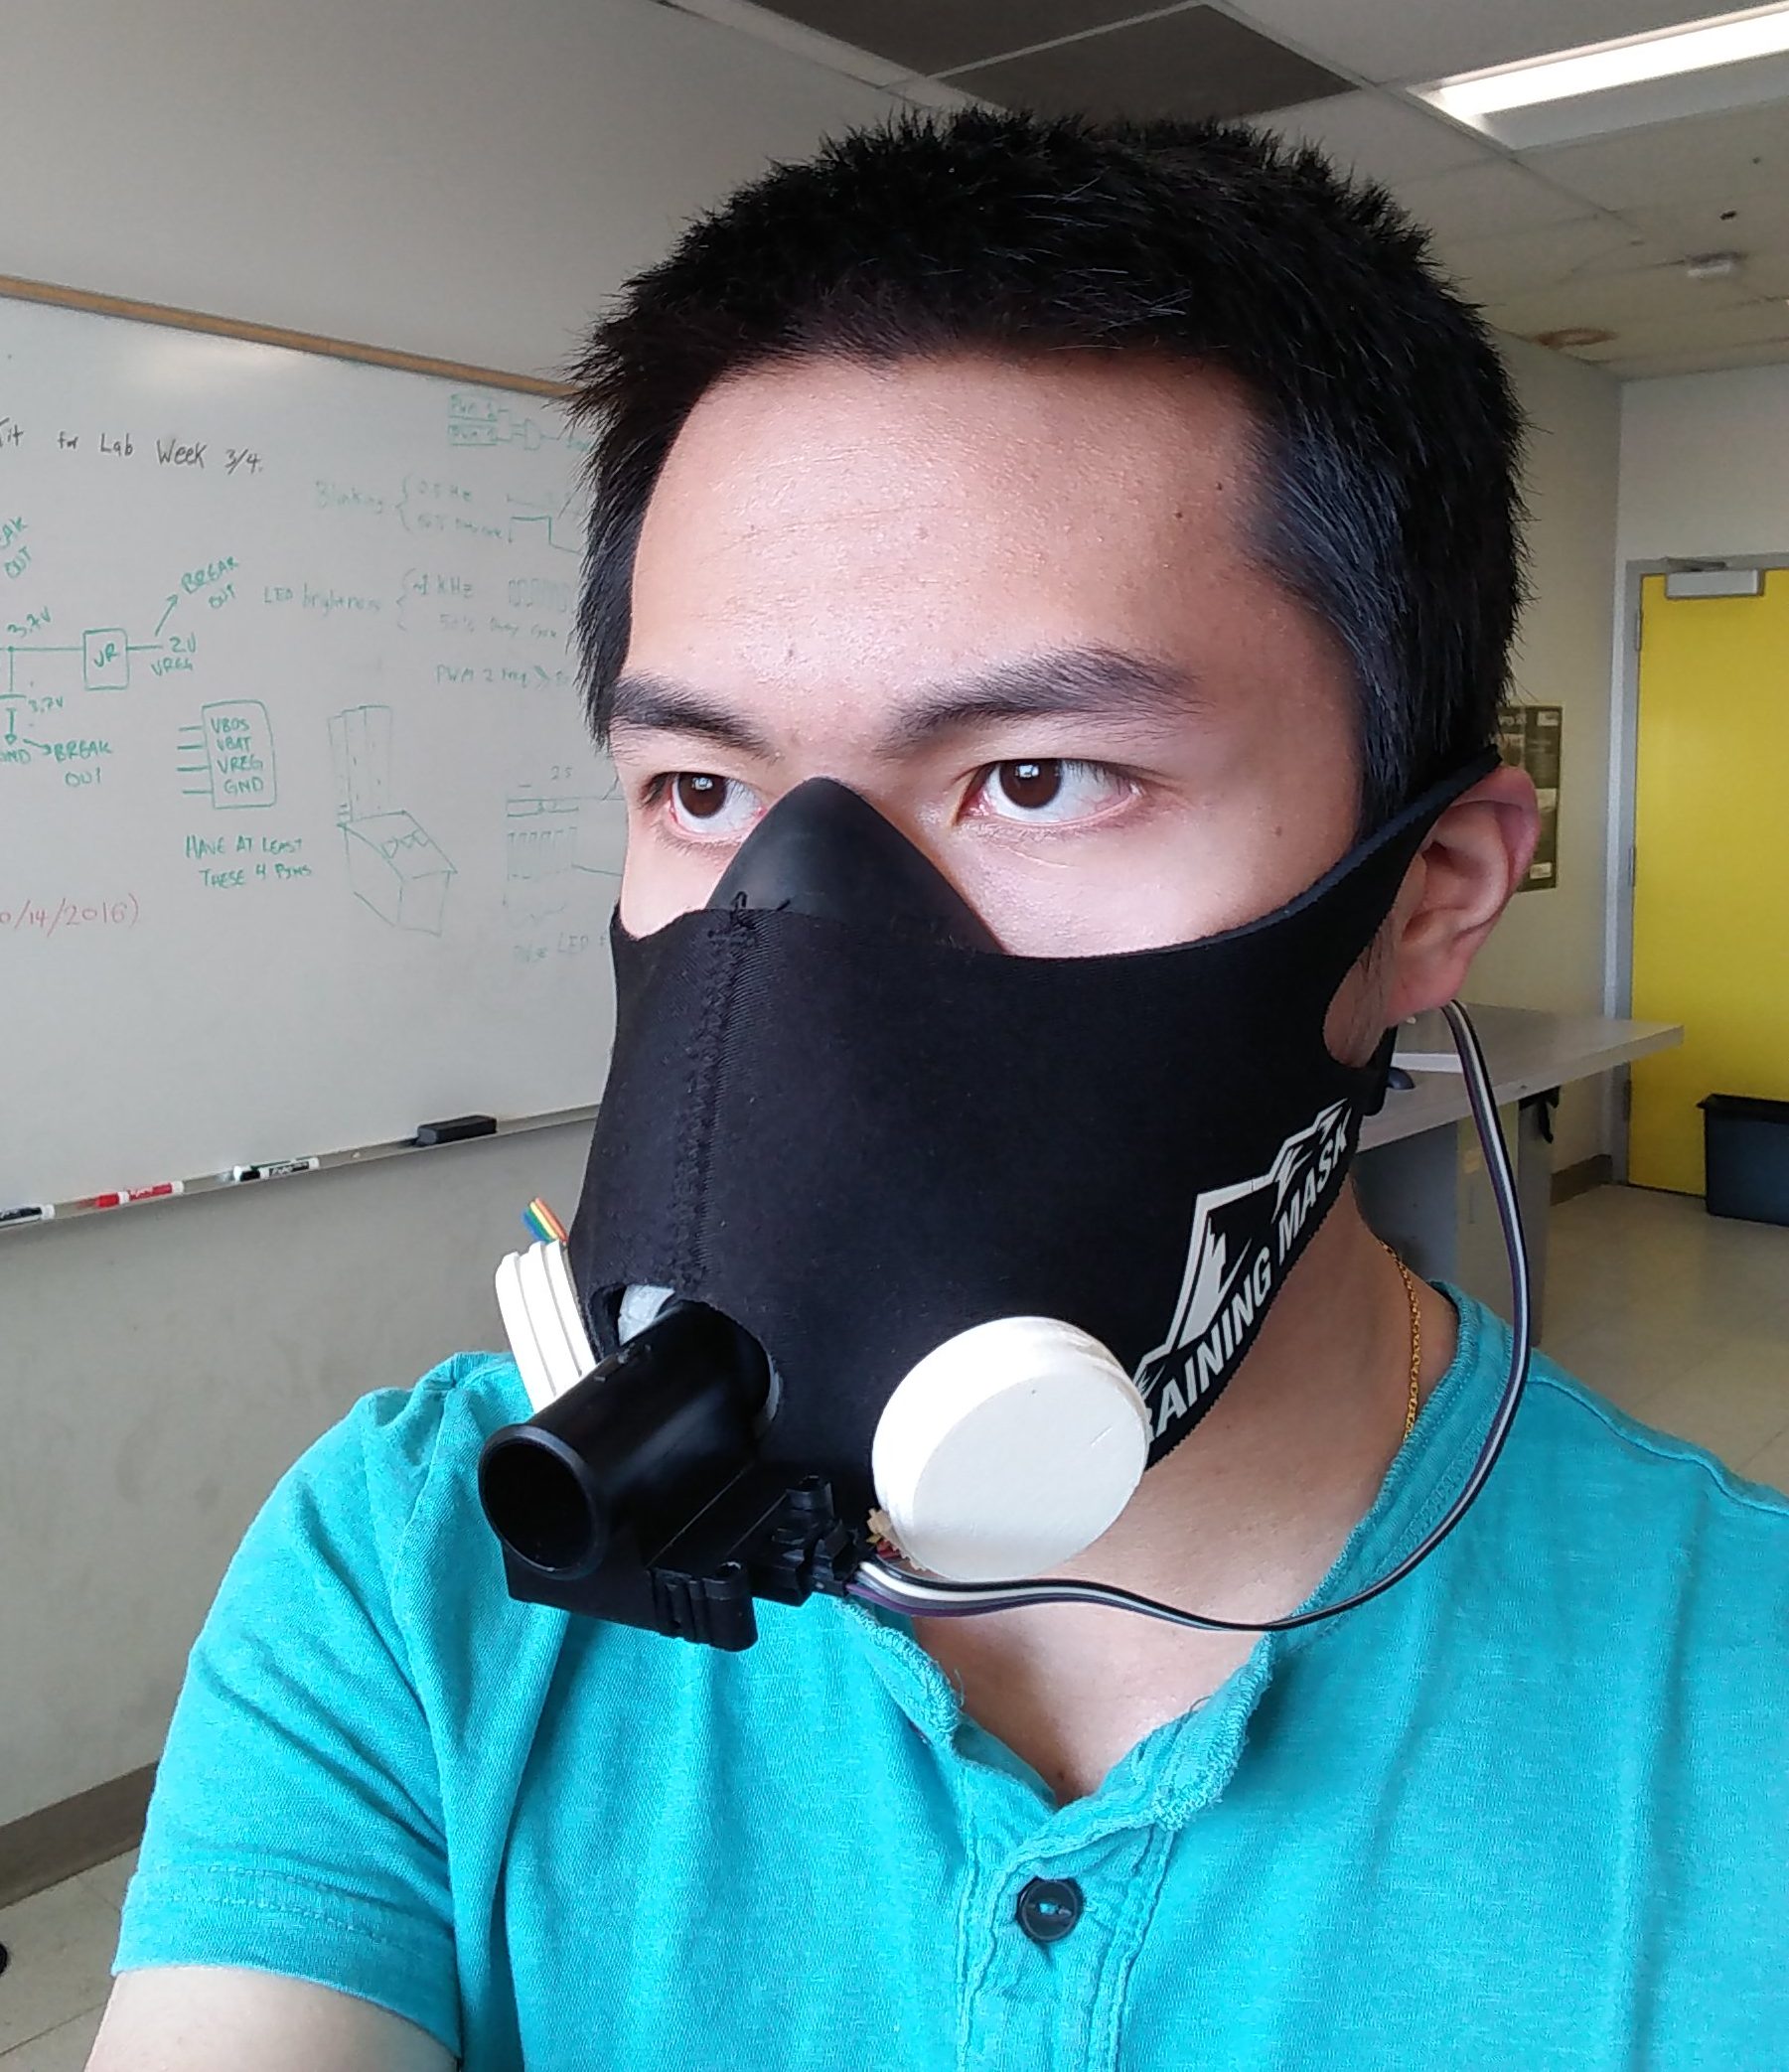
This project is aimed toward developing an solution to address the lack of a simpler, less intensive, and inexpensive test to give to patients who can not undergo a CPET. We present below, a mobile mask system designed to measure the patient’s oxygen and carbon dioxide concentration, the respiration rate, as well as their activity. Unlike state of practice, oxygen, carbon dioxide, and activity data can be continuously measured over a long period of time in the patient’s environment of choice. The mask is capable of wireless data transfer to a smartphone as well as to a cloud service where analytics and machine learning algorithms can be used to asses the patient’s health risks.
Hardware

Oxygen Sensor
We use a SST LOX-O2 sensor as the oxygen sensor in the mask. This sensor uses fluorescence quenching to detect the changes in oxygen concentration and has a detection range of 0-25%. Since atmospheric concentration is around 21% and the average resting respiration concentration is %16, this sensor’s detection range will suffice for the application.
Carbon Dioxide Sensor
Currently we are using a MinIR 100% CO2 Sensor which uses Non-Dispersive Infrared (NDIR) detection method. Its detection ranges from 0-100%. Although this range exceeds our use case – since carbon dioxide levels can rise to upward of 14% during exercise – its size and low power consumption fit our application.
Flow Sensor
Flow rate is measured using the Honeywell AWM730B5. This sensor measures the pressure difference from either ends of the tube given that the air flowing through it is laminar. It can measure flow rates up to ±300 liters per minute. The average resting flow rate of a person is in the range of 10-20 liters per minute and can rise as high as 200 liters per minute during exercise. This meter gives us the ability to measure at the extremes during exercise and testing.
Accelerometer
Using the Freescale MMA8652FCR1 accelerometer, activity data can be matched with respiration data to correlate exertion levels with CO2 and O2 respiration levels. The accelerometer reports acceleration in 3 axes x ,y and z. Running this data through a machine learning program, we can tell what activity the patient was performing e.g. walking, running, etc.
Microprocessors
The mask uses two microprocessors – the PSoC 4 BLE and the PSoC 5. The PSoC 5 is the more powerful chip and handles the communication and data collection of each sensor. It then sends this data to the second processor, the PSoC 4. The PSoC 4 BLE chip has Bluetooth capabilities and therefore it is used to send data to a smartphone containing our application.
Software
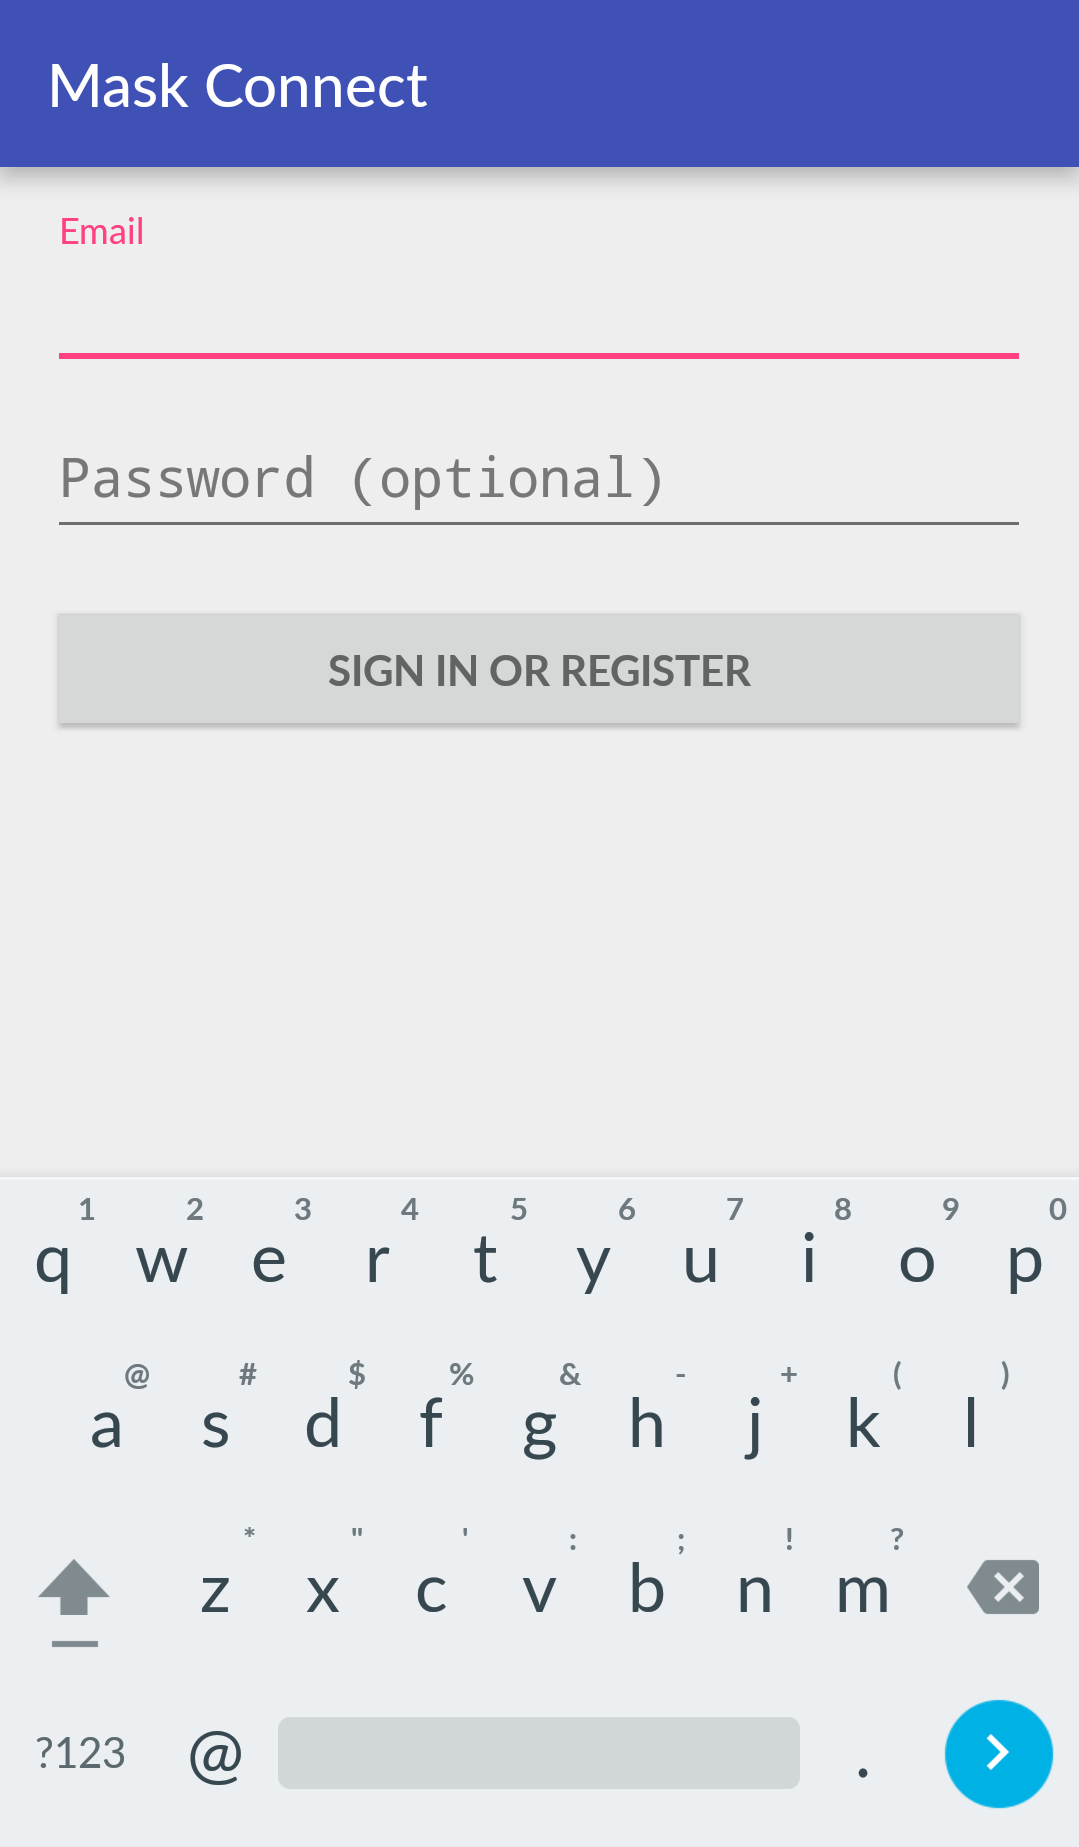
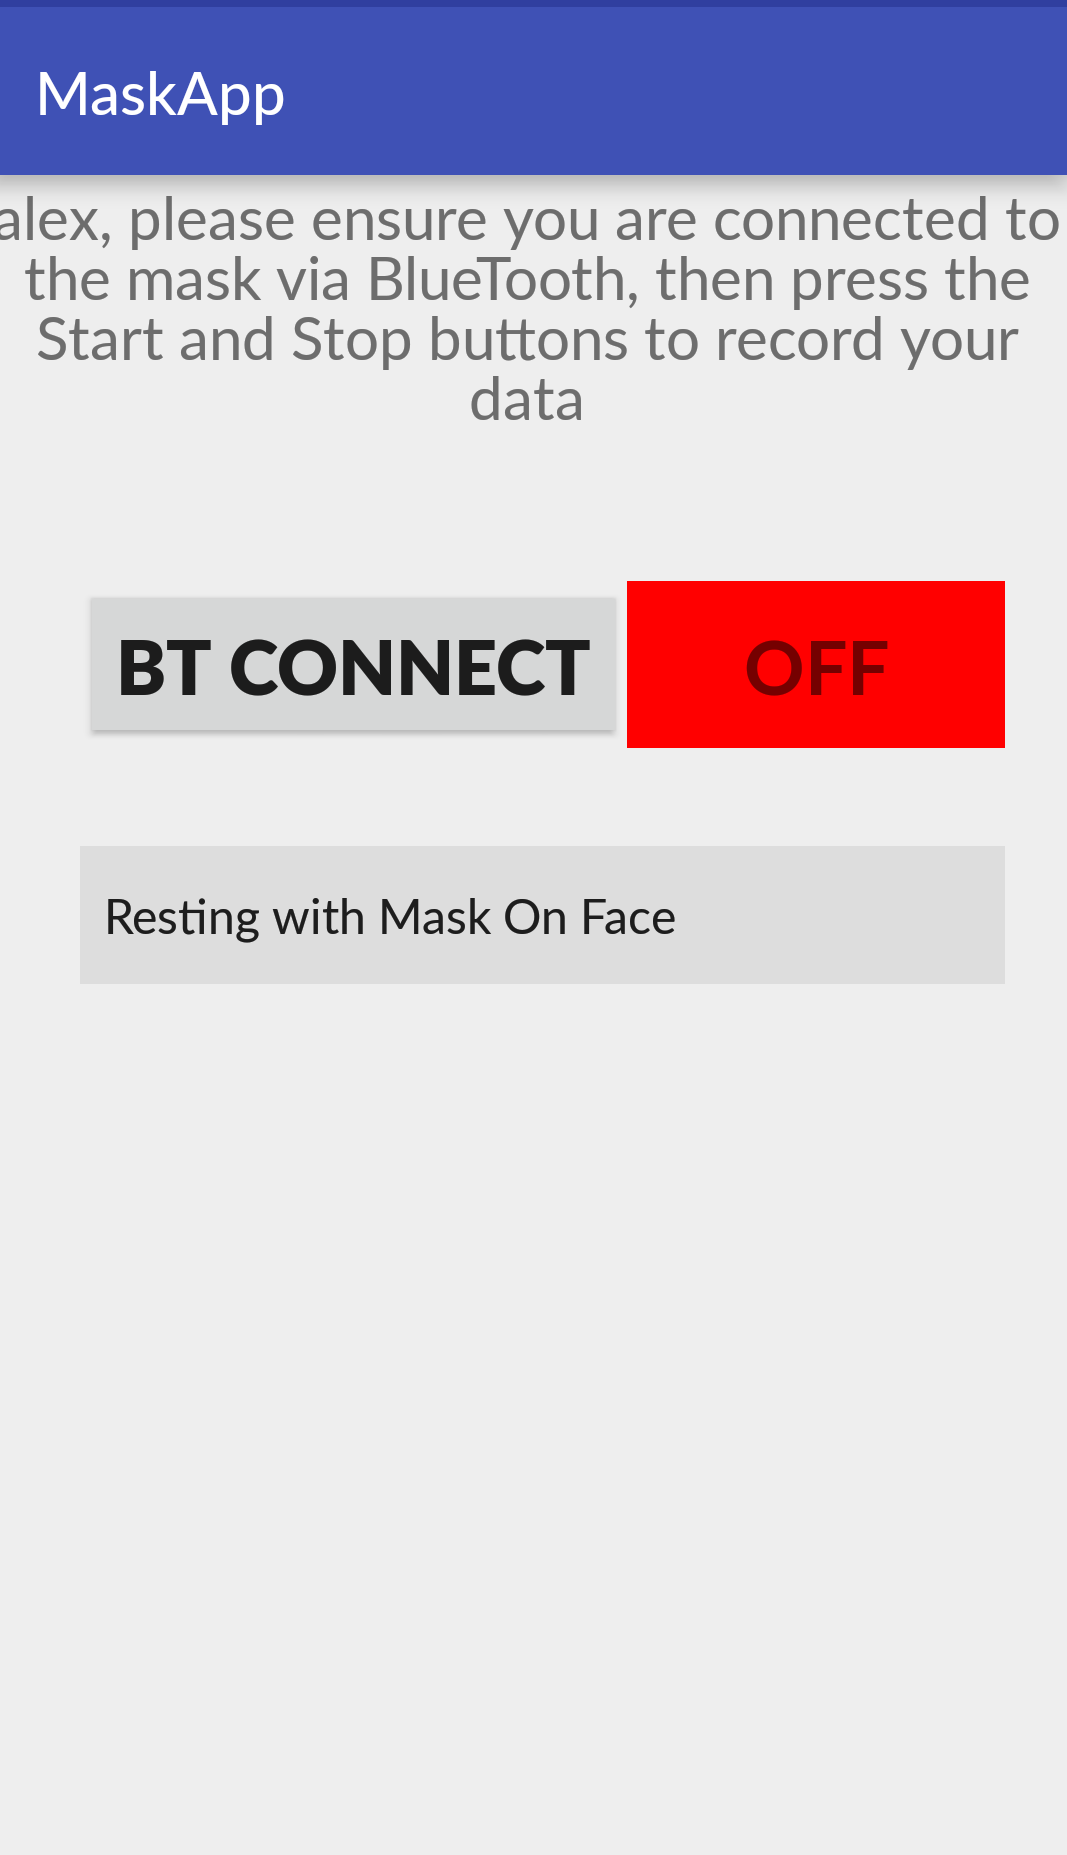
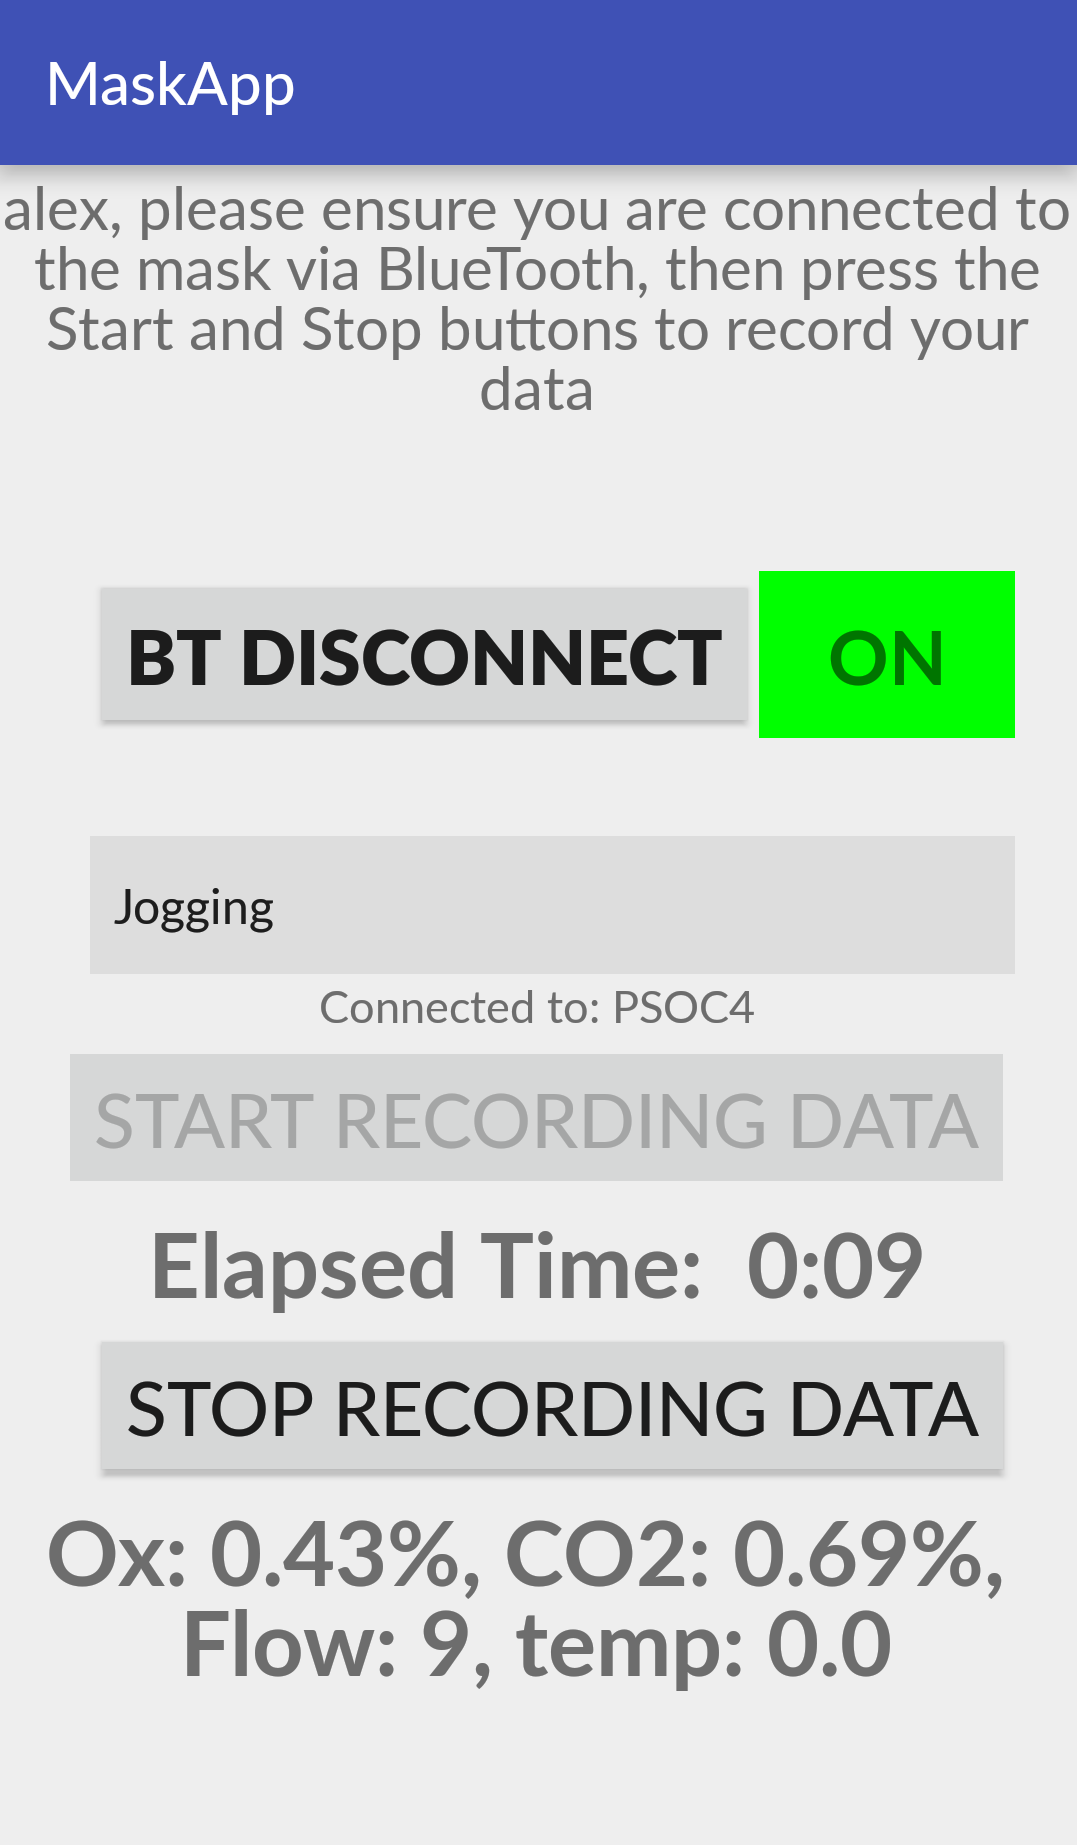
We created an Android application to monitor the sensor statistics in real time. The patient uses their email as identification in the application, and on the next page connects to the mask via Bluetooth Low Energy technology. Once connected, the user is able to start his trial by pressing the ‘Start’ button, where live statistics are then displayed on the app. These statistics are also sent, in real-time, to a cloud server (Firebase) where they are stored in a JSON format. Upon stopping the trial the entire trial data is also sent in a CSV file to the cloud.
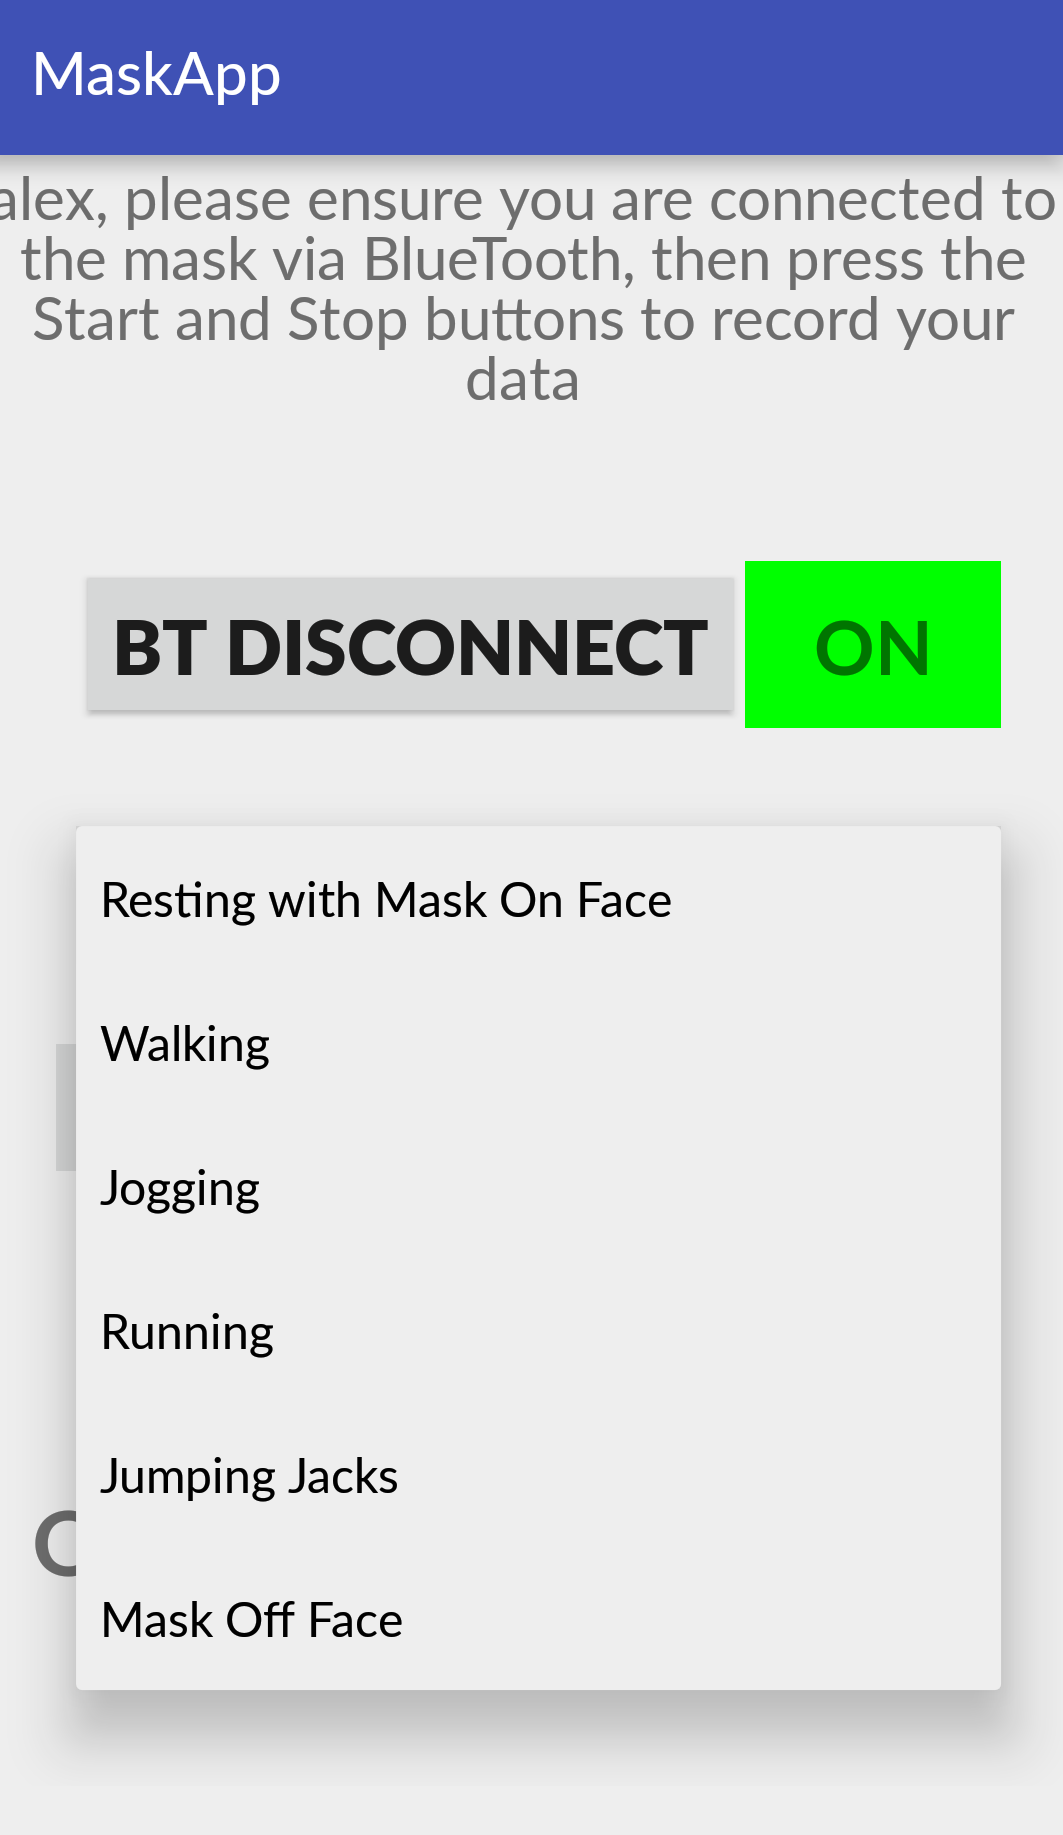
We have created a user interface to view the graphs of the gathered statistics of all the trials for each user on the web, using a Flask python framework hosted on Heroku. The website can be viewed at maskapp.herokuapp.com, and is intended to be login protected. A machine learning network is trained on previous data to attempt to predict the actions performed in each trial (resting, walking, jogging, running, jumping jacks, etc) based on the gathered parameters. The network is intended to be retrained and updated based on new data sets, to improve accuracy. There are several long term uses for the machine learning algorithm. One is for the doctor to be able to use the machine learning prediction to compare to a patients actual activity and see if there are anomalies. Another is to take unlabeled data and predict what a patient was doing at various periods of time. The algorithm will split the data into minute-long windows and the network will use attempt to predict the actions in these smaller windows. The web portal presents all of the parameters the mask reads. The long term goal is to allow the user of the portal to run a server-side analysis of the data and display predicted values overlaid on the data graphs.